




From Scan Data to Transaction Data: The New Manufacturer Intelligence Stack
TLDR
- Foodservice manufacturers have historically lacked the transaction-level data retail brands get from scan data.
- Cut+Dry’s network gives manufacturers SKU-level visibility across distributors, operators, geographies, and categories.
- Transaction data helps brands identify performance gaps, competitor displacement, and under-penetrated markets.
- Manufacturers using this data can allocate trade spend, launch products, and hold distributors accountable with more precision.
- The brands that move fastest on foodservice transaction data will gain a compounding competitive advantage.
The Data Gap That Defined an Industry
In retail grocery, scan data is table stakes. Every barcode scan at every checkout counter contributes to syndicated datasets that feed into platforms like Nielsen and IRI. A consumer packaged goods manufacturer can see exactly what’s selling where, to whom, and at what price. That data flows in weekly. It’s granular. It’s competitive. It’s the foundation of modern brand management.
Foodservice has never had any of this.
For a century, foodservice operators have been the last mile of distribution. A chef orders product from their distributor. The distributor fulfills it. The product gets used in a kitchen. And from the manufacturer’s perspective, almost everything beyond the distributor’s dock disappears into a black box. You know your distributor bought your product. You have no idea if that product is actually reaching operators, which operators, which locations, in what volumes, or at what price.
This is the intelligence gap that manufacturers in foodservice have learned to live with. You compete without knowing where your products are actually being sold. You fund promotions without knowing if they move volume. You launch new products without knowing which operators would be the most receptive. You negotiate with distributors without knowing if they’re actually performing relative to peers.
The retail industry solved this problem in the 1980s with scan data. Foodservice is solving it right now, for the first time, with transaction-level distributor data.
“For the first time, foodservice manufacturers can see exactly where their products are selling and why. That changes everything about how you compete.”
What Foodservice Data Actually Looks Like
Cut+Dry tracks $22 billion in GMV across 220+ distributors and 140,000+ operators. That’s 1.7 million SKUs moving across 8,100 product categories. And because every transaction flows through the platform, that represents the largest foodservice transaction dataset that exists.
For a manufacturer, that means real data. Not surveys. Not sales rep anecdotes. Not aggregated rebate reports. Actual transaction data at the SKU level, by operator, by distributor, by geography, in real time.
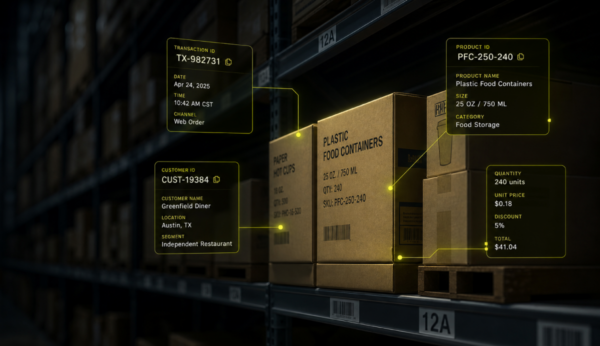
A branded product moving through a distributor to an operator shows up as a specific order on a specific day from a specific kitchen for a specific volume at a specific price. That transaction adds to 10,000 others just like it every single day across the network.
The intelligence you can build on that foundation is completely different from what existed before.
Which of your distributor partners are actually moving volume on your premium SKU versus your commodity version? You know. Which operator types are the best customers for a newly launched product? You know. Which geographies are underperforming relative to market potential? You know. Which competitors are displacing you in specific operator segments? You know.
This isn’t projection. It’s observation. It’s what’s actually happening in the market right now, not what you suspect is happening.
“The manufacturers winning today aren’t guessing about their market position. They’re measuring it.”
Why Retail Scan Data Wasn’t Enough
Some manufacturers tried to solve the foodservice intelligence problem by using retail scan data as a proxy. The logic was straightforward: if Sysco’s foodservice ingredient division is buying commodities from your manufacturing plant, those ingredients must be moving through the foodservice channel. Scan data from retail showing your product in supermarkets doesn’t tell you anything about foodservice.
This approach had predictable limitations. You could see that your products existed in some aggregate foodservice universe, but you couldn’t see:
Which specific operators were buying them. Scan data only exists at the retail level.
How much volume was actually moving. Foodservice operates on case volumes and bulk orders, not consumer package sizes. The price points are completely different.
What the competitive landscape looked like. Retail competitors aren’t always foodservice competitors. Your retail share tells you almost nothing about your foodservice market position.
What the upside actually was. You might be under-penetrated by a factor of ten in foodservice and have no idea because retail data doesn’t tell you that.
The manufacturers who tried to build foodservice strategies on retail scan data found themselves still operating blind. They just had a slightly better starting point than before.
Transaction-level foodservice data removes the ambiguity entirely. You’re looking at the actual market. You’re measuring actual sales to actual operators. You’re competing on data, not assumptions.
Building a New Intelligence Stack
For a manufacturer, the migration from “no data” to “transaction data” changes the entire intelligence architecture.
Start with basics. You need SKU-level performance data by operator type. How are independent restaurants responding to your products versus hotel chains or schools? Which operators are loyal customers and which are price-sensitive? Which are worth investing in for new product launches?
Layer on competitive displacement. When an operator switches from your product to a competitor, you need to see it. You need to know which competitors are winning in which segments. You need visibility into which products you’re losing and which you’re defending.
Add distributor accountability. Which of your distributor partners are actually executing against your SKU portfolio? Which ones are pushing commodity products and ignoring your premium line? Which ones have the strongest penetration in your highest-value operator segments?
Build forward-looking models. Where is your product under-penetrated relative to potential? Which operator segments should get the highest priority for campaigns? Which new products have the highest upside based on category attachment patterns?
This is the intelligence stack that didn’t exist before. This is what becomes possible when you have transaction visibility into foodservice.
The Competitive Intelligence Flywheel
The power of transaction data is that it compounds. The first month you have visibility, you see your current market position. By month three, you’re seeing shifts. By month six, you’re seeing patterns. By year one, you’re operating with market intelligence that your competitors don’t have access to.
A competitor still operating without transaction data is making strategic decisions based on assumptions. They’re allocating budgets to distributors they think are good partners but can’t prove it. They’re launching products hoping they’ll land well but not knowing which operators would be most receptive. They’re running the same playbook quarter after quarter because changing it requires admitting you don’t know what’s working.
Meanwhile, you’re seeing exactly what’s working. You’re moving budgets toward channels that deliver. You’re targeting new products to operators most likely to adopt them. You’re measuring campaign effectiveness in real time and adjusting before the quarter ends.
That gap doesn’t stay constant. It compounds. Every smart allocation decision you make multiplies your competitive position for the next decision. Every dumb allocation your competitors make weakens theirs.
The Generational Shift
This is roughly equivalent to the moment retail introduced scan data in the 1980s. The CPG manufacturers who invested in understanding that data immediately gained significant advantages over competitors who didn’t. By the time everyone had access to scan data, the gap had already been won by the brands who learned to use it first.
Foodservice is in that moment right now. The data exists. It’s available. The question is whether your organization is building strategy on it or still operating on hunches and historical precedent.
The manufacturers building against this data are building go-to-market strategies they can measure. They’re allocating budgets to channels they can prove work. They’re launching products they know will land. They’re operating with ten times more confidence because they’re operating with ten times more visibility.
The manufacturers still operating without it are going to find themselves increasingly uncompetitive, wondering why their trade spend multipliers are declining while their competitors’ are improving.
“The foodservice intelligence gap isn’t closing slowly. It’s closing all at once, for the manufacturers who move fast enough to see it.”
What You Should Be Asking
If you’re a foodservice brand manager and you don’t have access to transaction-level distributor data, that’s the first thing you should fix. Not eventually. This quarter.
The questions you should be asking are specific:
- Can I see my SKU performance by operator type and geography in real time? If not, why not?
- Can I see which of my distributor partners are actually moving volume versus which are just listing me in their catalog? If not, why not?
- Can I identify opportunities for new product launches without guessing which operators would be receptive? If not, why not?
- Can I measure the ROI on every dollar of trade spend I allocate? If not, why not?
The fact that you can’t answer these questions with your current data infrastructure isn’t your fault. Foodservice never had this data. But it does now. And the manufacturers moving fastest to leverage it are the ones who are going to define the category for the next decade.
If you want to understand what your actual foodservice market looks like — competitor displacement, distributor performance, operator white space, and SKU velocity — we can show you what 1.7M SKUs of transaction data reveals about your specific products in your key categories.